


Statistical Hypothesis Testing Template for T, Z, Chi-Square Tests
Original price was: $48.33.$37.53Current price is: $37.53.
Ready-to-use Excel template to run T tests, Z tests and Chi‑Square tests with clear outputs, interpretation notes and built-in calculators — designed for accountants, data analysts and businesses that need fast, accurate hypothesis testing without complex software.
Key benefits & value for the buyer
This statistical hypothesis testing template turns raw samples and contingency tables into clear statistical decisions—without leaving Excel. Unlike generic spreadsheets, this template is built around practical workflows used by accountants and analysts:
- Speed: Prepare, test and document results in minutes — reduces time spent switching tools.
- Accuracy: Built formulas follow standard statistical definitions (degrees of freedom, pooled variance, continuity correction for Chi‑Square where applicable).
- Clarity for non-statisticians: Each test includes an automated plain-language conclusion you can copy into reports or client emails.
- Compliance & audit trail: All calculations are visible and explainable — helpful for audit work and internal controls.
- Flexible licensing: Use the template as-is or pair it with ProXlsx hourly services for custom data import, dashboarding, or automation with VBA.
Use cases & real-life scenarios
Accountants & Financial Controllers
Compare mean revenues before/after a new pricing policy (paired T test), or validate whether expense ratios differ between departments (two-sample T test).
Data analysts & BI teams
Run Z Test Excel template-style analyses for large-sample proportion tests (e.g., conversion rates) directly inside Excel and export conclusions to dashboards.
Auditors & Consultants
Use the Chi Square test template to check independence between categorical variables (e.g., transaction type vs. exception flags) with a documented result for working papers.
SMEs & Operations Managers
Quickly validate A/B experiments or operational changes without buying statistical software—ideal for fast decision cycles and budget-sensitive teams.
Who is this product for?
The template is designed for professionals who already work in Excel and need reliable hypothesis testing without steep learning curves:
- Accountants preparing evidence-based financial analyses.
- Data analysts who prefer Excel-first workflows.
- Consulting teams and SMEs that require fast statistical checks.
- Audit teams needing transparent, explainable calculations.
How to choose the right version
We offer two delivery options to match different needs:
- Standard (XLSX): Clean, formula-driven workbook—no macros. Best when macros are restricted or company policy disallows them.
- Pro (XLSM): Macro-enabled version with automation for repeated runs, import helpers and a results-export routine. Recommended for analysts running frequent batch tests.
Choose Standard if you need maximum compatibility and transparency. Choose Pro if you want to save time on repetitive tasks and accept signed macros.
Quick comparison with typical alternatives
Alternatives include manual calculations, statistical packages or online calculators. Compared to these:
- Vs manual formulas: Fewer errors, faster interpretation and a consistent documentation model.
- Vs statistical software: Lower cost and simpler workflow for everyday business questions; keeps work inside Excel for easier sharing.
- Vs online calculators: Better privacy (data stays in-house), batch processing and auditability.
Best practices & tips to get maximum value
- Prepare your data: Remove duplicates and clearly label groups before pasting into the template.
- Choose the right test: Use the built-in assumptions checklist (normality, sample size, independence) to select T, Z or Chi‑Square.
- Document your steps: Keep the template’s output sheet with your raw data saved as supporting evidence for reports or audits.
- Use the Pro version for automation: If you run tests weekly, enable macros to import, run and export reports with one click.
- Leverage ProXlsx services: If you need data cleaning, dashboarding or VBA customization, order hourly support and get a tailored solution fast.
Common mistakes when buying/using similar products and how to avoid them
- Buying without checking compatibility: Verify Excel version and macro policy before choosing XLSM.
- Ignoring assumptions: Running a T test on non-normal small samples can mislead decisions—use the checklist included.
- Skipping documentation: Not saving raw inputs with results makes results hard to defend; always export a snapshot for audit trails.
- Expecting black-box answers: The template provides interpretation but you should review assumptions and business context before acting.
Product specifications
- Formats: XLSX (no macros) and XLSM (macro-enabled)
- Compatible with: Excel 2016, 2019, 2021, Microsoft 365 (Windows and recent Mac builds — macros limited on some Mac versions)
- Included sheets: Data input, T Test calculator, Z Test calculator, Chi‑Square calculator, Summary & interpretation, Assumptions checklist, Documentation
- Outputs: test statistics, degrees of freedom, p-values, confidence intervals, decision flag (Reject/Do not reject), plain-language conclusion
- Extras: Example datasets, step-by-step guidance notes and links to statistical references
- Delivery: Instant digital download after purchase
Frequently asked questions
Is this template safe to use in corporate environments with macro restrictions?
Yes. The standard XLSX version contains no macros and is suitable for environments that disallow macros. The XLSM Pro version includes optional macros which can be reviewed before enabling.
Can the template handle large datasets?
The calculators are optimized for typical business samples. For very large datasets (tens of thousands of rows) we recommend pre-aggregating sample statistics or contacting ProXlsx for a tailored solution or automation to handle batch processing.
Do I get documentation or help using the template?
Yes. Each purchase includes built-in documentation and example sheets. ProXlsx also offers paid hourly support to import your data, adapt the template to your company format, or create automated reports.
What if I need a different statistical test?
The template focuses on T, Z and Chi‑Square tests. If you need other tests (ANOVA, regression diagnostics, non-parametric tests), ProXlsx can provide a custom template or hourly development to extend functionality.
Ready to run reliable hypothesis tests in Excel?
Download the Statistical hypothesis testing template and start validating assumptions, running tests and producing audit-ready conclusions in minutes. Choose Standard (XLSX) or Pro (XLSM) at checkout.
Need customization or data import? Contact ProXlsx for hourly execution services and a quote.
Related products
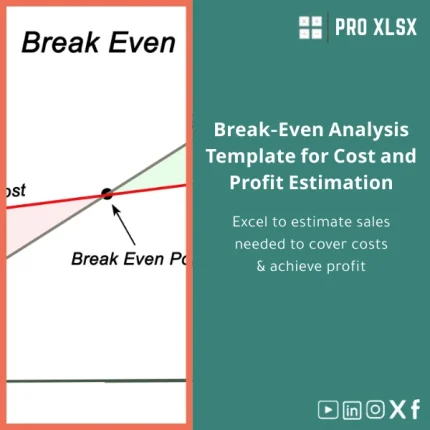
Break-Even Analysis Template for Cost and Profit Estimation
A ready-to-use Break-Even Analysis template in Excel to calculate the sales volume needed to cover costs, model profit scenarios, and produce clear management-ready charts and a margin of safety calculator. Designed for accountants, analysts, and companies who need fast, reliable decision support without complex systems.


Reviews
Clear filtersThere are no reviews yet.