


Portfolio Return and Risk Template for Excel Analysis
Original price was: $94.23.$75.33Current price is: $75.33.
A ready-to-use Excel template to compute expected portfolio return, portfolio standard deviation, beta and scenario analyses — built for accountants, data analysts, and corporate teams who need fast, auditable investment metrics without complex software.
Key benefits & value for your workflow
This Portfolio return and risk template turns raw price or return series into audited portfolio metrics fast. Instead of manual calculations across multiple sheets, you get a single workbook that:
- Reduces time-to-insight — set up with your data and get portfolio expected return, variance and beta in minutes.
- Improves accuracy — formulas and covariance calculations are transparent and testable, reducing spreadsheet errors in reports and client deliverables.
- Supports decision-making — scenario testing and weight-optimization-ready outputs help you evaluate rebalancing choices and risk exposures.
- Saves costs — cheaper and faster than building custom BI solutions; integrates with existing Excel-based processes and audit trails.
How the core calculations work (practical summary)
The template computes expected portfolio return as the weighted average of asset returns. Portfolio variance is calculated via the weights’ quadratic form with the covariance matrix (w’Σw); standard deviation is the square root of variance. Beta is estimated through covariance with a benchmark series (Cov(asset, benchmark) / Var(benchmark)) aggregated for a weighted portfolio beta. All steps include visible formulas and intermediate sheets so auditors can trace results.
Use cases & real-life scenarios
Monthly client reports — accountants
An accounting firm can import monthly returns for ten client portfolios, run the template to extract each portfolio’s expected return and risk, and paste results into standardized PDF reports. The included formatting and export-ready tables reduce manual reformatting by 70%.
Risk review for SMEs — financial controller
A company treasury managing a modest investment pool can test how a sudden 5% market shock affects portfolio standard deviation and individual holdings’ beta contributions before revising investment policy.
Portfolio analytics for advisors — data analyst
Advisors preparing proposals can use the investment portfolio analysis spreadsheet as a quick portfolio return calculator template to compare scenarios and present trade-offs between expected return and volatility to clients.
Who is this product for?
- Accountants preparing audited investment schedules and client performance reports.
- Data analysts who need a reliable portfolio risk analysis Excel tool for dashboards or further modelling.
- Small-to-medium companies that track corporate investments without buying enterprise risk software.
- Financial advisors and consultants requiring a repeatable, branded calculation workflow.
If your team uses Excel as a primary analysis tool and needs accurate, traceable portfolio metrics quickly, this template fits your workflow.
How to choose the right version (size & features)
Choose based on asset count and automation needs:
- Base template — supports up to 50 assets, manual data import, formulas only (recommended for most accountants and analysts).
- Large-portfolios version — supports up to 250 assets and faster covariance generation (for funds and larger advisory teams).
- Macro-enabled version (VBA) — adds automated data refresh, file import and report export. Choose this if you want repeatable automation; note that macros require enabling and are compatible with Windows Excel.
Unsure? Contact ProXlsx to review your dataset — we offer hourly customization and can adapt the template to your exact asset count and reporting needs.
Quick comparison with typical alternatives
- Manual spreadsheets: faster to use, auditable formulas, fewer human errors, and standardized outputs.
- Custom-built BI tools: much lower upfront cost and simpler integration into Excel-based processes; ideal if you do not need enterprise systems.
- Cloud platforms: easier collaboration but higher subscription costs and potential compatibility issues with local accounting practices and privacy requirements.
Best practices & tips to get maximum value
- Feed returns (not prices) when possible — it simplifies calculations and avoids rescaling errors.
- Keep a backup of raw data sheets before running scenarios; the template separates raw input and calculation layers for safety.
- If you use macros, enable them only for trusted templates and keep a non-macro copy for audit purposes.
- Use the scenario sheet to test extreme cases (e.g., 20% market drop) before presenting to stakeholders.
Common mistakes when buying or using similar templates — and how we prevent them
- Buying a template that assumes a different data layout — our template documents required input columns and includes sample import mapping to avoid confusion.
- Overlooking compatibility — we list Excel version compatibility and provide a macro-free version for macOS/online viewers.
- No support after purchase — ProXlsx includes clear documentation and optional hourly support for setup and customization.
Product specifications
- File format: .xlsx (macro-free) and optional .xlsm (macro-enabled)
- Excel compatibility: Microsoft Excel 2016, 2019, 2021, Microsoft 365; macro functions work on Windows Excel
- Included sheets: Inputs, Returns, Covariance Matrix, Portfolio Metrics, Scenario Analysis, Documentation & Examples
- Assets supported: Base up to 50; Large up to 250 (see versions)
- Language: English (number formatting localized); templates easily localizable
- Delivery: Instant download after purchase with documentation and step-by-step example
- Optional services: hourly data import, custom VBA automation, custom branding and report export (available from ProXlsx)
Frequently asked questions
Is this template compatible with Google Sheets?
The macro-free .xlsx version opens in Google Sheets, but some advanced formula behaviour and large covariance calculations may perform slower. For full functionality (and VBA automation) use Microsoft Excel on Windows. We can convert and test a Google Sheets version as a paid service.
Can I use my own benchmark series to calculate portfolio beta?
Yes. The template accepts user-supplied benchmark returns. The beta calculation uses the covariance between asset returns and your chosen benchmark, then aggregates to a portfolio beta based on weights.
What kind of support do you provide after purchase?
Each purchase includes documentation and an example dataset. If you need help mapping your data, automating imports, or customizing outputs, ProXlsx offers hourly implementation services priced separately.
How do I know the formulas are correct?
All calculation steps are exposed across sheets — weights, covariance, variance, and beta components are visible and traceable. We follow standard finance formulas and provide worked examples so you can audit the results against your data.
Ready to standardize your portfolio analytics?
Download a proven, auditable Portfolio return and risk template and start producing accurate portfolio metrics today. Quick setup, clear documentation, and optional hands-on support from ProXlsx for custom needs.
Need help selecting a version or want a custom adaptation? Contact ProXlsx for a free pre-purchase consultation and hourly implementation options.
Related products
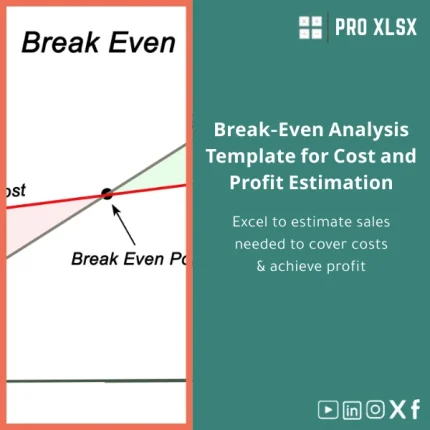
Break-Even Analysis Template for Cost and Profit Estimation
A ready-to-use Break-Even Analysis template in Excel to calculate the sales volume needed to cover costs, model profit scenarios, and produce clear management-ready charts and a margin of safety calculator. Designed for accountants, analysts, and companies who need fast, reliable decision support without complex systems.


Reviews
Clear filtersThere are no reviews yet.