


Operational Efficiency Analysis Template for Excel
Original price was: $94.23.$75.33Current price is: $75.33.
Excel tool to measure and compare resource‑use efficiency across departments — ready dashboards, audit‑proof formulas, and configurable KPIs that let accountants, data analysts and operations teams turn raw records into actionable improvements within hours.
Key benefits & value for buyers
The Operational Efficiency Analysis template converts scattered time, cost and output records into consistent, comparable insights. Below are the direct business outcomes you can expect immediately after implementation:
Speed — less time to decision
Replace manual consolidation with a structured workbook: paste monthly data, refresh, and get department scorecards in minutes. Typical clients cut reporting time by 60–80%.
Accuracy — standardized KPIs
Built-in normalization and guarded formulas reduce reconciliation errors. The template calculates utilization rate, productive vs idle time, throughput per employee, and cost per unit with audit trails.
Actionability — clear, prioritized insights
Dashboards highlight top improvement opportunities (high cost-per-output, low utilization) so managers know where to focus interventions and measure the impact of changes over time.
Use cases & real-life scenarios
Accounting & audit departments
Use the operational performance analysis sheet to show auditors consistent allocation of overheads, resource utilization per cost center, and trends for headcount planning.
Manufacturing and operations
Compare production lines or shifts on throughput per labour-hour and cost per unit, then simulate the effect of overtime, reallocation, or process changes using the built-in scenario section.
Service departments and public administration
Track response time vs. staff allocation across branches, measure cases closed per FTE, and present a simple efficiency index to stakeholders without complex BI systems.
Consultants & analysts
Deploy the template to clients during discovery workshops for fast baseline assessments; export visuals directly into presentations.
Who is this product for?
- Accountants preparing monthly resource‑use reports and variance explanations.
- Internal operations analysts benchmarking department performance.
- SME owners and line managers who need immediate, low‑cost insight without a BI license.
- Consultants and auditors delivering efficiency diagnostics to clients.
How to choose the right version
This is an Excel template, but there are options depending on your needs. Choose based on dataset size, level of automation, and whether you need ProXlsx implementation support:
- Basic (no macros) — For small datasets and strict macro policies. Works on Excel for Windows/Mac and online with limited interactivity.
- Standard (recommended) — Includes Power Query setup, dashboard sheets and locked formulas for safe distribution.
- Pro (macros + automation) — Adds VBA routines for scheduled exports, printable reports and faster consolidation (requires Excel for Windows with macros enabled).
- Custom implementation (hourly) — ProXlsx offers hourly services to map your chart of accounts, integrate source extracts, and deliver a turnkey workbook.
Quick comparison with typical alternatives
Consider three common approaches — in-house spreadsheets, BI tools, and our Operational Efficiency Analysis template.
- In-house spreadsheets: Low upfront cost but high long-term maintenance and inconsistent KPIs.
- BI platforms: Powerful at scale, but require integration, licenses and time — good for large datasets but costly for smaller teams.
- Operational Efficiency Analysis template: Fast to deploy, affordable, and flexible. Best for teams that need immediate, transparent KPIs without new software.
Best practices & tips to get maximum value
- Prepare a clean source file: consistent department codes and dates; use the sample import sheet as a template.
- Use locked cells and protect sheets before sharing with managers to avoid accidental changes.
- Configure thresholds for alerts (e.g., utilization < 65%) and use conditional formatting for quick visibility.
- Schedule a short customization session with ProXlsx to map your chart of accounts and automate imports.
- Keep a versioned backup before major changes — templates update faster than rework after errors.
Common mistakes when buying/using similar templates — and how to avoid them
- Mistake: Assuming one KPI fits all. Fix: Customize weights and normalization settings in the template to reflect your output measures.
- Mistake: Overloading with raw data. Fix: Aggregate sensible periods (weekly/monthly) and use Power Query to handle large extracts.
- Mistake: Disabling protections. Fix: Keep formulas locked and document permitted input ranges for users.
Product specifications
- File format: .xlsx (Office Open XML)
- Compatibility: Excel 2016 / Office 365 (Windows & Mac); macros optional — required for Pro features
- Included sheets: Data import, Normalization, KPI calculations, Department scorecards, Dashboards, Scenario analysis, Documentation
- Built-in metrics: Utilization rate, Throughput per FTE, Cost per unit, Idle time %, Efficiency index
- Automation: Optional VBA routines for consolidation and exports (Pro version)
- Localization: English; customization available for Arabic labels and local chart of accounts
- Delivery: Immediate digital download after purchase; ProXlsx hourly services available for customization and data mapping
FAQ
Is this Operational Efficiency Analysis template compatible with Excel for Mac or Excel Online?
Can you customize the template to match our chart of accounts and department codes?
Are macros safe and is there documentation?
What if the template doesn’t meet our needs — is there a refund or support?
Ready to start measuring and improving operational efficiency?
Get the Operational Efficiency Analysis template now and begin turning monthly records into prioritized action. If you prefer, add ProXlsx implementation hours and get a tailored workbook mapped to your systems.
Need help choosing a version or want a quick demo? Contact ProXlsx for a free 15‑minute consultation before purchase.
Related products
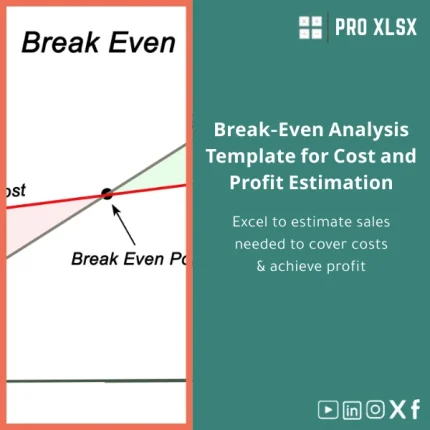
Break-Even Analysis Template for Cost and Profit Estimation
A ready-to-use Break-Even Analysis template in Excel to calculate the sales volume needed to cover costs, model profit scenarios, and produce clear management-ready charts and a margin of safety calculator. Designed for accountants, analysts, and companies who need fast, reliable decision support without complex systems.


Reviews
Clear filtersThere are no reviews yet.