


Mean and Standard Deviation Calculator Tool Template
Original price was: $15.93.$13.23Current price is: $13.23.
A ready-to-use Excel mean and standard deviation calculator that computes sample and population statistics instantly, cleans messy columns, and produces a printable summary and chart — built for accountants, data analysts, and businesses that need fast, accurate statistical measures without writing formulas from scratch.
Key benefits & value for the buyer
This Mean and Standard Deviation calculator template removes repetitive setup and common Excel errors so your team spends time interpreting results — not debugging formulas. Key buyer benefits:
- Save time: Paste data and read immediate outputs (mean, SD sample/population, count, min/max, standard error).
- Reduce risk: Pre-validated formulas (STDEV.S, STDEV.P) and data-cleaning logic prevent incorrect calculations caused by blank cells or text entries.
- Professional output: Ready-to-print summary and chart that you can attach to reports or include in dashboards.
- Scalable: Use for small samples or large population-level datasets; supports grouped calculations if you provide a category column.
- Local support: ProXlsx support and optional hourly customization if you need integration with your chart of accounts, ERP export, or audit format.
Use cases & real-life scenarios
Monthly accounting checks
Accountants can paste numerical extracts from a GL column to validate average transaction values and volatility (standard deviation) before journal adjustments.
Operational KPI analysis
Operations managers use the template to measure average lead time and its variability across warehouses, quickly seeing whether process changes reduce standard deviation.
Audit sampling and analytics
Auditors and financial analysts calculate sample vs population SD to determine appropriate sampling techniques and estimate confidence intervals for substantive testing.
Quality control & reporting
Quality teams track product weight or defect rates; the template highlights shifts in mean and dispersion over time with a trend chart for management reports.
Who is this product for?
Short answer: professionals who need reliable statistical measures quickly, including:
- Accountants and auditors preparing analytical review summaries.
- Data analysts producing quick statistical checks before deeper modeling.
- Small to medium businesses that require accurate KPI measures without BI systems.
- Consultants who need a repeatable template to deliver to multiple clients.
How to choose the right configuration
There is one core template with optional add-ons you can request from ProXlsx:
- Standard file — includes mean and standard deviation (sample and population), summary table, and chart.
- Grouped calculations — for datasets with categories (e.g., by region or product) to compute mean and SD per group.
- Weighted mean/SD — add-on when values have frequencies or weights (useful for aggregated reports).
- VBA automation — optional macro to import CSV and output a report automatically (ask for a custom quote).
Choose the standard file for most needs; request grouped or weighted options when your dataset includes categories or frequency columns.
Quick comparison with typical alternatives
Common alternatives are manual Excel setups, in-house macros, or full BI tools. Compared to those:
- Versus manual setup: this template avoids formula mistakes and saves hours of setup.
- Versus bespoke macros: ready now and easy to adapt without waiting for development cycles.
- Versus BI systems: cheaper and faster for straightforward statistical checks where a full dashboard is unnecessary.
Best practices & tips to get maximum value
- Always paste raw numeric data into the designated input column; do not overwrite formula cells.
- Use the sample/population toggle based on your measurement approach: choose population when your dataset equals the full population.
- Run a quick data-cleaning step (remove obvious outliers) before computing mean and SD if outliers are known to be data errors.
- Save the template as a new file for each reporting period to keep an audit trail.
- Contact ProXlsx for small customizations — typical changes are delivered hourly and can be integrated into existing reporting workflows.
Common mistakes when buying/using similar templates and how to avoid them
- Buying the wrong build: some templates only calculate one type (sample or population). Our template includes both and a clear toggle.
- Ignoring compatibility: ensure Excel version compatibility — our template supports Excel 2016+, Excel for Microsoft 365.
- Overlooking data format: mixing text and numbers leads to wrong counts. Use the provided cleaning helpers or request data-normalization add-ons.
Product specifications
- File format: .xlsx (compatible with Excel 2016, 2019, 2021, and Microsoft 365)
- Includes: Input sheet, Calculation sheet, Summary & Chart sheet, Instructions page
- Formulas: STDEV.S (sample) and STDEV.P (population), COUNT, AVERAGE, VAR where applicable
- Optional: VBA macro version available on request (delivered as separate workbook with instructions)
- Languages: English interface; Arabic labels available on request for Egyptian clients
- Delivery: Instant download after purchase + email support for setup
- License: Single-user license; contact ProXlsx for multi-user/corporate licensing and hourly customization
Frequently asked questions
What Excel versions are supported?
The template is compatible with Excel 2016, 2019, 2021 and Microsoft 365 on Windows and Mac. If you need backward compatibility (Excel 2010/2013) or Google Sheets conversion, contact ProXlsx for a custom export.
Does it calculate sample and population standard deviation?
Yes. The template includes both sample (STDEV.S) and population (STDEV.P) calculations and a clear toggle so you can switch the baseline method used in summary reporting.
Can I customize the template to use weighted data or grouped categories?
Yes. Grouped calculations and weighted mean/SD are available as add-ons. ProXlsx offers hourly customization to integrate group keys, frequencies, or to automate imports from your system.
What if I have problems opening the file?
Contact support and include a screenshot or the error message. ProXlsx provides troubleshooting and replacement files; for most issues we can resolve within one business day.
Ready to stop building formulas and start analyzing?
Download the Mean and Standard Deviation calculator now and start producing reliable statistical summaries in minutes. If you need a small customization for your reports, choose hourly implementation from ProXlsx experts.
Instant download. Local support available. For multi-user licenses or bulk orders, contact ProXlsx for a corporate package.
Related products
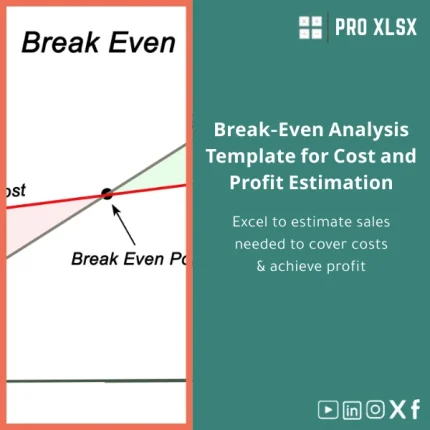
Break-Even Analysis Template for Cost and Profit Estimation
A ready-to-use Break-Even Analysis template in Excel to calculate the sales volume needed to cover costs, model profit scenarios, and produce clear management-ready charts and a margin of safety calculator. Designed for accountants, analysts, and companies who need fast, reliable decision support without complex systems.

Excel Bank Reconciliation Template for Accurate Financial Tracking

Excel Cash Flow Template for Tracking Inflows and Outflows

Financial Analysis Template for Key Financial Ratios in Excel
Flexible Budgeting Template for Excel Analysis
Interest Calculation Template for Excel with Cash Discounts
An Excel-ready interest calculation template that computes simple and compound interest, generates early‑payment cash discount schedules, and converts those results into clear reports and cashflow tables — built for accountants, data analysts, and finance teams who need reliable, fast answers without custom development.


Reviews
Clear filtersThere are no reviews yet.