


Logistic Regression Template for Trend Analysis
Original price was: $94.23.$75.33Current price is: $75.33.
A ready-to-use Excel template for binary and multiclass logistic regression with built-in trend analysis, diagnostics, and dashboard reporting — designed for accountants, data analysts and businesses that need fast, accurate predictive models without writing code.
Key benefits & value for the buyer
The Logistic Regression template converts raw Excel tables into interpretable predictive models and decision-ready reports. Instead of manually calculating coefficients and building charts, you get:
- Time savings: From raw data to validated model and dashboard in minutes — reduces repetitive modelling tasks for finance and audit teams.
- Explainable outputs: Coefficients, odds ratios and significance levels are presented in auditor-friendly format for stakeholder review.
- Actionable trend signals: Detect changes in conversion rates, default risk, or fraud probability over time with built-in trend charts and rolling windows.
- Scalable workflow: Use the same template for ad-hoc analysis or integrate into monthly reporting with one-click refresh.
- Lower cost than custom development: A professional Excel solution without long development cycles or expensive statistical software licenses.
Use cases & real-life scenarios
1. Credit risk & delinquency trend
An accounting team uses the template to predict probability of default using payment history, invoice age, and customer segments. Weekly retraining highlights an upward trend in a specific industry — enabling timely policy changes.
2. Customer churn prediction for subscription services
Marketing imports engagement metrics and contract history, builds a binary logistic regression model, and targets high-probability churn customers with retention campaigns. Visualized probability deciles guide budget allocation.
3. Audit risk scoring and sampling
Internal auditors score invoices and suppliers for fraud risk using multiclass outcomes (low/medium/high). The dashboard shows trend shifts and highlights items for focused review.
Who is this product for?
Designed specifically for:
- Accountants and auditors who need statistical support inside familiar Excel workbooks.
- Data analysts and business analysts working in SMEs and firms without Python/R toolchains.
- Finance teams building early-warning systems and monthly reports.
- Consultants and advisors who deliver quick predictive insights to clients.
How to choose the right version
Choose based on the complexity of your project and automation needs:
- Basic (Binary): Pre-built workflows for yes/no outcomes, manual refresh — ideal for one-off analyses or small teams.
- Pro (Multiclass + Dashboard): Handles multiclass outcomes, includes interactive charts, sample build scripts, and export-ready tables for reports.
- Automation add-on: Adds VBA macros for scheduled refreshes and one-click retrain; recommended if you update models regularly.
- Hourly customization: If you need feature additions (custom encodings, different link functions, or integration with your ERP), order execution time from ProXlsx services.
Quick comparison with typical alternatives
- Manual Excel formulas: Cheaper initially but error-prone and slow for diagnostics and visualization. Template provides audited formulas and consistent outputs.
- Statistical software (R/Python/SPSS): More flexible but requires coding skills and infrastructure. The template gives similar model outputs in Excel-ready form.
- BI tools / Custom dashboards: Great for visualization but rarely include statistical modelling by default. Template pairs well with BI exports to keep modelling inside Excel.
Best practices & tips to get maximum value
- Prepare clean datasets: remove duplicates, handle missing values, and use consistent categorical labels.
- Start with a small feature set: build a baseline model, then add variables to avoid overfitting.
- Use train/test splits and review ROC/AUC and confusion matrix before operationalizing predictions.
- Translate coefficients to business terms (e.g., change in odds per 1% revenue drop) for stakeholder buy-in.
- Schedule regular retraining if your data distribution changes (seasonality, policy changes, or market shifts).
Common mistakes when buying or using similar templates — and how to avoid them
- Mistake: Using logistic regression for continuous targets. Fix: Confirm your target is categorical (binary or ordinal/multiclass).
- Mistake: Ignoring class imbalance. Fix: Use weighting or sampling strategies included in the template and review precision/recall, not only accuracy.
- Mistake: Overfitting by including too many correlated predictors. Fix: Use multicollinearity checks and stepwise selection included in the tool.
Product specifications
- File type: .xlsx (Excel workbook)
- Compatibility: Excel 2016+, Office 365 (Windows). VBA features available on Windows; core functions work on Mac with limited macro support.
- Included sheets: Data input, Model setup, Diagnostics, ROC & confusion, Trend dashboard, Sample dataset, User guide.
- Features: Binary & multiclass logistic regression, probability scoring, confidence intervals, variable encoding, ROC/AUC, confusion matrix, trend charts, optional VBA automation.
- Documentation: Step-by-step user guide + example dataset and annotated formulas.
- Support: Email support + paid hourly customization services available through ProXlsx.
- Recommended dataset size: Works well from a few hundred rows upward; model stability improves with larger samples.
Frequently asked questions
Which Excel versions support all features (including VBA)?
Full functionality with VBA macros is supported on Excel for Windows (2016 and later) and Office 365. The core modelling and charts work on Mac, but some VBA automation features may be limited on Mac—contact us for a Mac-optimized variant.
Can I customize the template for our company variables and output format?
Yes. The template is editable and we also offer hourly customization services to adapt encodings, bespoke reports, or integrate output with your reporting templates. Custom work is available via ProXlsx execution services.
Is there documentation or a demo to help non-statisticians?
Included: a step-by-step user guide, annotated example workbook, and practical notes on interpreting odds ratios and trend outputs. For teams that need training, ProXlsx offers paid training sessions.
What if the template doesn’t meet our needs?
We evaluate requests for reasonable changes and offer a support channel to resolve setup issues. For incompatibilities, contact support for troubleshooting. Customized work can be quoted separately.
Ready to build reliable trend-based classification models in Excel?
Purchase the Logistic Regression template now and start turning your historical data into actionable probability scores and trend signals. The template is designed to fit into accounting workflows and operational reporting with minimal setup.
Need customization or hourly execution? Contact ProXlsx after purchase to request additional services — we deliver fast, practical Excel solutions tailored for Egyptian companies and finance teams.
Related products
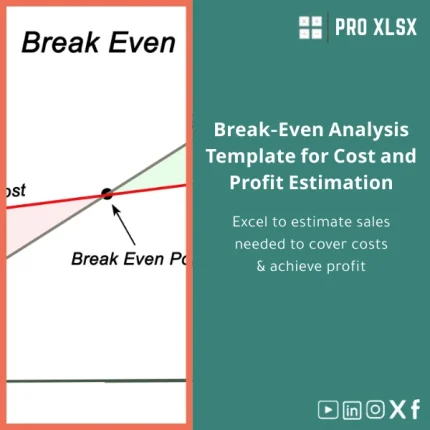
Break-Even Analysis Template for Cost and Profit Estimation
A ready-to-use Break-Even Analysis template in Excel to calculate the sales volume needed to cover costs, model profit scenarios, and produce clear management-ready charts and a margin of safety calculator. Designed for accountants, analysts, and companies who need fast, reliable decision support without complex systems.
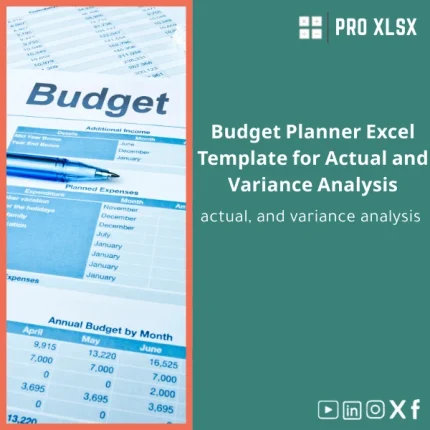
Budget Planner Excel Template for Actual and Variance Analysis

Excel Cash Flow Template for Tracking Inflows and Outflows
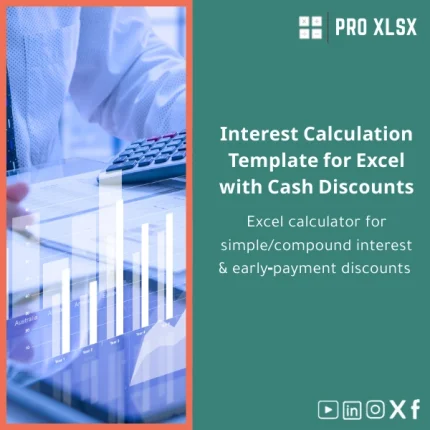
Interest Calculation Template for Excel with Cash Discounts
An Excel-ready interest calculation template that computes simple and compound interest, generates early‑payment cash discount schedules, and converts those results into clear reports and cashflow tables — built for accountants, data analysts, and finance teams who need reliable, fast answers without custom development.


Reviews
Clear filtersThere are no reviews yet.