


Hypothesis Testing Sheet Template for T-Tests & Chi-Square
Original price was: $53.73.$42.93Current price is: $42.93.
Run one-sample, independent and paired T‑tests and Chi‑Square tests directly in Excel with a ready-to-use, audit-friendly Hypothesis Testing Sheet — designed for accountants, analysts, and companies that need fast, accurate statistical checks without learning complex software.
Key benefits & value for accountants and data teams
This Hypothesis Testing Sheet turns raw samples into defensible statistical conclusions without leaving Excel. It removes repetitive calculation steps, reduces human error, and produces reporting-ready outputs that fit into audit trails and management decks.
Business benefits
- Faster validation: Complete T‑tests and Chi‑Square checks in minutes instead of manually computing test statistics and critical values.
- Consistency: Standardized template enforces the same assumptions and reporting layout across teams.
- Traceability: Inputs, formulas, and outputs remain in a single workbook suitable for review and archival.
- Cost-effective: Avoid expensive statistical packages or consultant hours for routine hypothesis checks.
Use cases & real-life scenarios
Practical examples where the Hypothesis Testing Sheet saves time and improves decisions:
Accounting & Audit
Compare mean balances before and after a policy change (paired T‑test), or test whether fraud incidence differs across branches (Chi‑Square).
Operational Analytics
Validate whether a new process reduced average handling time (independent T‑test) or whether categorical defect rates are independent of machine type (Chi‑Square).
Marketing & Sales
Test whether conversion rates differ between campaigns using grouped sample proportions and Chi‑Square contingency testing.
Who is this product for?
Designed specifically for:
- Accountants and auditors who need quick statistical checks for sampling and materiality tests.
- Data analysts and BI teams performing routine hypothesis testing inside financial models.
- SMEs and corporate finance departments that want accurate, documented statistical outputs without extra software.
- Consultants and academic researchers who prefer Excel-native hypothesis testing templates.
How to choose the right setup
This is a digital template; selection is about choosing the right options and add-ons at purchase:
- Basic template: Ready-made sheet for T‑tests and Chi‑Square. Best if you only need standard tests and annotated results.
- With sample data examples: Includes pre-filled examples and interpretation notes — ideal for training teams.
- With customization (hourly service): Add bespoke calculations, integrate with your ERP export format, or automate result snapshots via VBA.
If unsure, choose the basic template and add hourly customization later — ProXlsx offers on-demand execution and modification services to adapt the sheet to your file formats.
Quick comparison with typical alternatives
How this Hypothesis Testing Sheet compares to common approaches:
- Manual Excel calculations: Manual approach increases error risk. This template centralizes formulas and interpretation text to avoid mistakes.
- Statistical packages: Packages are powerful but require training and infrastructure. The template offers fast, accessible testing for routine work inside Excel.
- Outsourcing to consultants: Consultants are useful for complex projects; this template covers repeatable checks at a fraction of the cost—use consultant hours for one-off custom tasks.
Best practices & tips to get maximum value
- Keep a raw-data tab and a separate “analysis” tab — the template is designed for this separation to maintain traceability.
- Always document assumptions (normality, equal variances, sample independence) in the provided notes area.
- Use the template’s interpretation text as a starting point for management reports; adapt wording to your company’s tone.
- When automating with VBA, make a backup copy first — ProXlsx can provide safe automation scripts on request.
Common mistakes when buying or using hypothesis testing templates — and how to avoid them
- Buying the wrong variant: Check whether you need paired vs independent tests; ask for an example before purchase if unsure.
- Misinterpreting p-values: The template includes interpretation hints — read them and match thresholds to your policy.
- Forgetting data cleaning: Garbage in, garbage out. Use the template’s data validation steps.
Product specifications
- Product type: Excel template (XLSX)
- Primary tests: One-sample T-test, Independent T-test, Paired T-test, Chi‑Square test / contingency table
- Compatibility: Excel 2016+, Excel for Microsoft 365, Mac Excel (no special add-ins required)
- Includes: sample data sheet, instructions & interpretation notes, calculation sheet, printable results summary
- Optional: Hourly customization and VBA automation services (available on request from ProXlsx)
- Language: English (interface and notes), adaptable via customization
FAQ
Can I use the template with non-normal data or small samples?
The template documents assumptions and alerts for small sample sizes. For non-normal data or very small N, consider bootstrapping or non-parametric alternatives — ProXlsx can add such routines as a customization.
Will formulas be visible and auditable?
Yes — all formulas are transparent and left unlocked for auditors. If you require locked/obfuscated worksheets for distribution, ProXlsx can prepare a protected version while retaining an editable master.
Is the template compatible with Excel on Mac and Office 365?
Yes. The template uses standard Excel functions to maximize compatibility across Excel for Windows, Mac, and Office 365. Advanced VBA features are optional and noted before use.
What if I need the template in Arabic or connected to an ERP export?
Language localization and data-mapping to ERP exports are available as hourly services. Provide a sample export file and ProXlsx will adapt the sheet to your format.
Ready to run reliable T‑tests and Chi‑Square checks in Excel?
Download the Hypothesis Testing Sheet now and start producing audit-ready statistical results today. If you need integration, customization, or on-demand execution, choose one of our hourly packages after purchase.
Related products
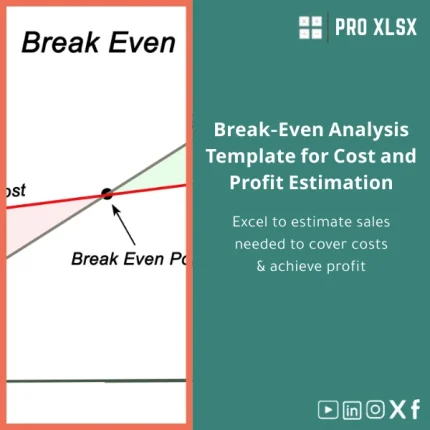
Break-Even Analysis Template for Cost and Profit Estimation
A ready-to-use Break-Even Analysis template in Excel to calculate the sales volume needed to cover costs, model profit scenarios, and produce clear management-ready charts and a margin of safety calculator. Designed for accountants, analysts, and companies who need fast, reliable decision support without complex systems.


Reviews
Clear filtersThere are no reviews yet.