


Interactive Higher Education Dashboard Template for KPI Visualization
Original price was: $94.23.$75.33Current price is: $75.33.
Interactive Excel file to visualize academic, research, and administrative KPIs — a ready-to-use Higher Education Dashboard that turns raw university data into clear, decision-ready reports and interactive charts without costly BI systems.
Key benefits & value for buyers
From data to decisions — measurable outcomes
The Higher Education Dashboard converts disparate departmental reports into a single source of truth. Instead of manual reconciliations and static PDFs, you get:
- Faster monthly reporting: Reduce report preparation time by up to 60% through automated data tables and one-click exports.
- Better stakeholder visibility: Boards and faculty receive tailored KPI views (enrollment, retention, research income, grant spend, staff FTE) with contextual targets and traffic-light indicators.
- Lower cost than BI tools: Built in Excel, it avoids license and implementation costs of enterprise BI systems while remaining extensible.
- Reliable calculations: Pre-built formulas, data validation and reconciliation checks reduce error risk in financial and operational metrics.
Use cases & real-life scenarios
How institutions typically use this Higher Education KPI dashboard:
Monthly finance & budget review
Financial controllers import trial balances and expense ledgers to monitor budget variance, grant utilization, and cash position with pivot-based charts and variance waterfall visualizations.
Academic performance and enrollment
Registrars and planning teams use the admissions and retention modules to track cohort performance, course enrollment trends, and program-level attrition rates with cohort filters and trend lines.
Research portfolio and grants management
Research offices consolidate project-level budgets, milestones and income forecasting to flag underspent grants and upcoming deliverables.
Management reporting & accreditation
Create printable executive packs and presentation-ready charts for council meetings and accreditation reviews. The template exports to standard image and PDF formats.
Who is this product for?
This Higher Education Dashboard is built for:
- Accountants and financial controllers at universities and colleges who need accurate monthly and year-to-date views.
- Data analysts and institutional research teams who must deliver interactive reporting without complex ETL pipelines.
- Consultancies and service providers offering performance reporting for higher education clients.
- Small-to-medium institutions in Egypt and the region that prefer cost-effective Excel-based solutions and local support.
How to choose the right edition
We offer flexible options depending on your needs:
- Standard template: Ready-made dashboards, data import sheets, and basic slicers — ideal for single-department use.
- Advanced template (recommended): Includes multi-department consolidation, VBA automation for imports/exports, and scenario controls for top-level management.
- Customization service (hourly): ProXlsx provides hourly customization — mapping your export files, adding KPIs, or creating export-ready reports.
Choose Standard if you need immediate installation at low cost; choose Advanced if you require automation and consolidation across units. For bespoke needs, our hourly service saves time and reduces risk.
Quick comparison with typical alternatives
Compared with manual Excel workbooks: this template adds structure, validation and dashboards that reduce errors and save time.
Compared with cloud BI tools: the template keeps costs and complexity low, while providing similar visual outputs suitable for internal and board reporting. If you later scale to BI platforms, exported reports and standardized data sheets make migration simpler.
Best practices & tips to get maximum value
- Standardize your export filenames and columns — the template includes mapping examples to speed imports.
- Use the Advanced edition for monthly automation (VBA macros) and schedule routine exports to reduce manual steps.
- Keep a staging copy of raw data and use the dashboard only for cleaned and reconciled datasets.
- Document KPI definitions in the ‘Readme’ sheet — this preserves consistency between departments and auditors.
Common mistakes when buying or using dashboards — and how to avoid them
- Buying a generic dashboard without data mapping: Ask for a sample data map or use our hourly mapping service to ensure fields match your exports.
- Ignoring Excel version or macros: Choose the edition that matches your environment — macros-enabled for automation, or macro-free for strict IT policies.
- Underestimating change management: Train 1–2 power users and create a one-page process for monthly updates to prevent backsliding into manual reports.
Product specifications
- File format: .xlsx (macros-enabled version .xlsm available)
- Compatibility: Microsoft Excel 2016 or later (Windows recommended for full VBA support). Basic features work in Office 365 Excel for Mac; macros require Windows Excel.
- Sheets included: Dashboard(s), Raw Data import, KPI definitions, Lookup tables, Reconciliation checks, Readme & Instructions.
- Language: English (custom Arabic labels available via customization)
- License: Single-institution license — commercial use allowed within purchasing entity (see license sheet)
- Support: 30 days standard support; paid hourly customization and data services available through ProXlsx.
- Delivery: Immediate download after purchase + optional consultancy scheduling.
FAQ
Do I need VBA or special add-ins to use the dashboard?
No — the standard template runs fully without macros using native Excel functions and slicers. If you want recurring automation (one-click imports, scheduled exports), choose the macros-enabled Advanced edition. No third-party add-ins are required.
What Excel version is required?
The template is designed for Excel 2016 or later on Windows. Office 365 Excel supports all visual features; Mac users can use core dashboard features but will need Windows Excel for full VBA automation.
Can you customize KPIs and export formats for our institution?
Yes. ProXlsx provides hourly customization and full project work — mapping your source files, adding institutional KPIs, and creating bespoke report packs. Contact us after purchase or schedule an hourly session in advance.
How secure is my data when using the template?
The template runs locally in Excel; no data leaves your environment unless you export or share files. If you purchase customization services, you choose secure transfer methods and confidentiality terms.
Ready to convert university data into clear decisions?
Download the Interactive Higher Education Dashboard today and start generating board-ready KPI reports in hours, not weeks. If you need mapping or automation, add our hourly customization service — local specialists at ProXlsx will implement and validate the dashboard with your data.
Related products
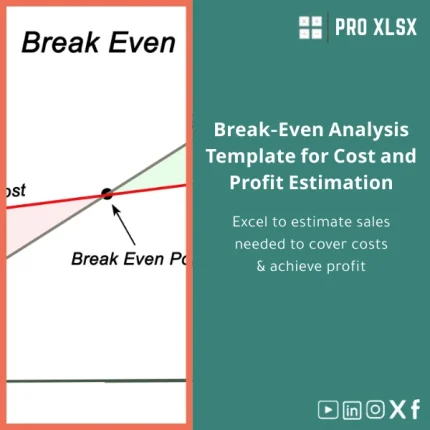
Break-Even Analysis Template for Cost and Profit Estimation
A ready-to-use Break-Even Analysis template in Excel to calculate the sales volume needed to cover costs, model profit scenarios, and produce clear management-ready charts and a margin of safety calculator. Designed for accountants, analysts, and companies who need fast, reliable decision support without complex systems.

Comprehensive Accounting Program in Excel Template
Customers Suppliers Tracking Template for Excel Invoices and Payments
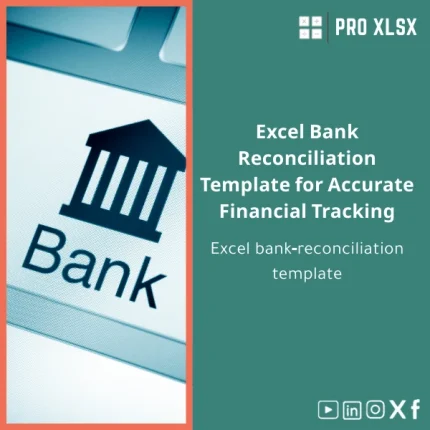
Excel Bank Reconciliation Template for Accurate Financial Tracking
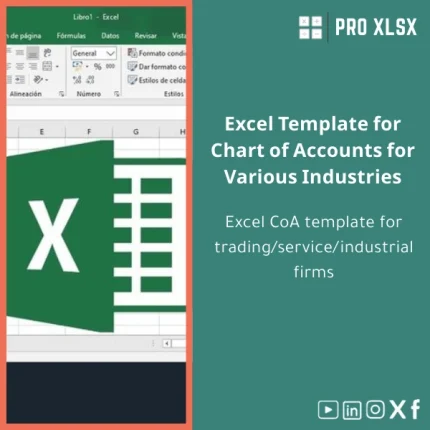
Excel Template for Chart of Accounts for Various Industries

Indirect Manufacturing Costs Allocation Template in Excel
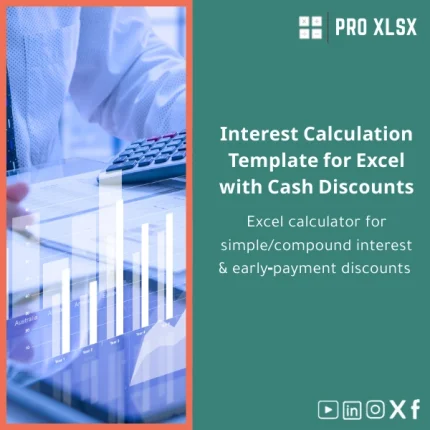
Interest Calculation Template for Excel with Cash Discounts
An Excel-ready interest calculation template that computes simple and compound interest, generates early‑payment cash discount schedules, and converts those results into clear reports and cashflow tables — built for accountants, data analysts, and finance teams who need reliable, fast answers without custom development.


Reviews
Clear filtersThere are no reviews yet.