


Financial Performance Evaluation Template for Departments in Excel
Original price was: $48.33.$37.53Current price is: $37.53.
A ready-to-use Excel workbook to evaluate departmental financial performance — measure profitability, control costs, and track efficiency with clear KPIs, interactive dashboards, and automated reports that accountants and analysts can deploy immediately.
Key benefits & value for the buyer
This financial performance evaluation template translates raw GL and departmental cost data into meaningful insights that drive decisions. Instead of building reports from scratch, you get a tested structure that saves time, reduces errors, and standardizes department evaluation across periods.
Features translated into business value
- Prepared KPI set: Standard profitability and efficiency metrics so managers compare departments on the same basis — faster performance reviews.
- Configurable cost allocation: Choose between headcount, direct costs, or activity drivers to make allocations realistic and defensible during audits.
- Interactive dashboard + printable report: One-click executive summary plus printable monthly reports for stakeholders.
- Data validation & error checks: Minimizes manual mistakes and gives confidence in figures presented to stakeholders and auditors.
- Optional automation: Use Power Query to refresh data or add VBA to automate monthly rollovers, reducing repetitive manual tasks.
Use cases & real-life scenarios
The template adapts to common departmental performance needs across industries. Typical scenarios:
Example 1 — Monthly profit review for 5 departments
An SME loads month-end GL exports for cost and revenue accounts, assigns department tags, and gets a side-by-side report showing departmental gross margins, operating cost ratios, and headcount-adjusted cost per unit. Managers identify the least profitable department and run a simple break-even analysis in the same workbook.
Example 2 — Cost control & variance analysis
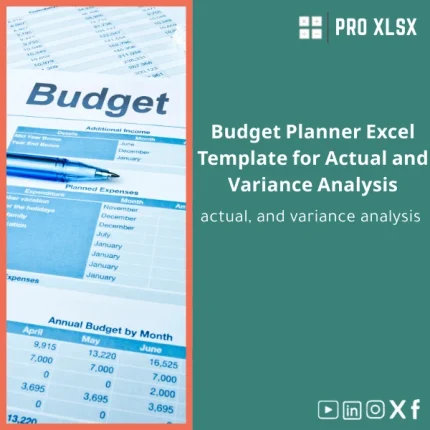
The finance team uses budget vs. actual tabs and the variance driver table to highlight where costs exceeded targets — is it higher usage, rate increases, or reclassification? The template produces variance breakdowns and charts for the next board pack.
Example 3 — Consolidated KPIs for consultants and auditors
Consultants combine monthly files across clients to create comparative dashboards. Auditors use the template’s validation sheet to trace net profit back to source transactions quickly.
Who is this product for?
This financial performance evaluation template is built for:
- Accountants and controllers who prepare monthly departmental reports
- Financial analysts and data analysts doing profitability and cost analysis in Excel
- Small to medium companies that need structured department KPI evaluation without buying heavy BI tools
- Consultants and auditors who require consistent templates for client work
How to choose the right version
The template is flexible, but pick the version that matches your environment:
- Basic: For single-company use, manual data entry, no macros. Suitable for teams that prefer simple workflows.
- Power-Query enabled: For users who can export GL/ledger to CSV/Excel and want one-click refreshes.
- Automation (VBA) option: Adds monthly rollover macros and one-click report generation — ideal for recurring monthly reporting cycles.
Compatibility note: works on Excel 2016 and later (Windows and macOS). Power Query features require Excel 2016+ / Microsoft 365.
Quick comparison with typical alternatives
Choose this template if you need speed, clarity, and control without high implementation costs.
- Manual spreadsheets: Faster to deploy, fewer structural errors, and standardized KPIs compared to ad-hoc sheets.
- Dedicated BI tools: Lower upfront cost and simpler to maintain for common departmental KPIs; no need for heavy IT or subscription fees.
- Custom development: Off-the-shelf template + optional hourly customization provides a predictable budget versus bespoke projects.
Best practices & tips to get maximum value
- Map your chart of accounts to the template’s account groups before importing data to avoid reconciliation work.
- Use department codes consistently in source systems to enable automated grouping with Power Query.
- Run the validation sheet after each import to catch mapping errors early.
- Keep a monthly archive tab (automated in the VBA version) for trend analysis and audit trails.
- Start with the basic KPI set; customize only the allocation drivers and reporting labels to keep comparability.
Common mistakes when buying/using similar templates and how to avoid them
- Buying a template without checking Excel compatibility: Verify your Excel version and whether you need Power Query or macros enabled.
- Not aligning account mapping: Spend 30–60 minutes mapping accounts before loading data — this prevents most errors.
- Over-customizing early: Avoid heavy changes in the first month; validate KPIs on raw data first, then tweak presentation.
- Expecting a plug-and-play integration with non-standard ERP exports: Be prepared for a brief mapping step or request ProXlsx hourly support for setup.
Product specifications
- File format: .xlsx (Excel workbook)
- Compatibility: Excel 2016+, Excel for Microsoft 365 (Power Query optional)
- Sheets included: Input (GL & Departments), Mapping, KPI Dashboard, Department Detail, Budget vs Actual, Variance Analysis, Validation, Instructions
- Automation: Optional VBA macros package (monthly rollover, print pack) — provided with instructions and permission prompts
- Localization: English documentation; numeric formatting suitable for EGP and multi-currency presentation
- Deliverables: Downloadable file, sample dataset, step-by-step setup guide, 30-minute complimentary setup support via ProXlsx hourly services
FAQ
Is the template compatible with my ERP or accounting software exports?
Yes — the template accepts standard Excel/CSV exports of the general ledger or transactional lists. If your export uses non-standard columns, ProXlsx offers hourly mapping services to adapt the template quickly.
Will this template handle more than ten departments or consolidated entities?
The workbook scales to dozens of departments. For consolidated entities, use consistent department codes or request a light customization to add consolidation rules.
What support is included after purchase?
The download includes a setup guide and sample data. ProXlsx provides 30 minutes of complimentary setup support; additional customization or data-mapping is available on an hourly basis.
How secure is my financial data when using this Excel file?
The template runs locally in Excel — your data never leaves your machine unless you choose to upload it. For shared environments, we recommend using secure internal file servers or SharePoint with access controls.
Ready to evaluate departmental performance faster?
Buy a professionally designed Financial performance evaluation template and start producing consistent departmental reports today. If you need customization, ProXlsx offers fast hourly services to map your data and automate monthly updates.


Reviews
Clear filtersThere are no reviews yet.