


Correlation Analysis Template for Strength & Direction (r)
Original price was: $37.53.$26.73Current price is: $26.73.
A ready-to-use correlation analysis template for Excel that calculates Pearson’s r, displays strength & direction, and generates clean tables and charts—built for accountants, data analysts, and companies needing fast, reliable relationship analysis without coding.
Key benefits & value for the buyer
This correlation analysis template converts raw paired data into immediate insight. Instead of building formulas and charts from scratch, you get a tested Excel correlation template that saves time, reduces errors, and produces presentation-ready outputs.
Below are feature-to-benefit translations that matter when making a purchase decision.
Features translated into business value
- Automated Pearson r calculation: Eliminates manual formula errors—trustworthy results for reports and audits.
- Correlation matrix for multiple variables: Spot relationships across KPIs (sales vs discount, cost vs volume) quickly.
- Interpretation labels: Each r value is classified (strong/weak, positive/negative), saving time when writing conclusions.
- Pre-made charts and exportable tables: Ready for client presentations or management dashboards.
- Sample dataset & guidance: Built-in examples and short instructions reduce onboarding time for teams.
- Optional VBA automation: Batch-process multiple sheets or files—useful for recurring monthly analyses.
Use cases & real-life scenarios
How accountants, data analysts, and operations teams use this correlation analysis Excel sheet in practice:
- Monthly financial reviews: Compare sales and marketing spend to identify whether higher spend correlates with revenue increases.
- Audit sampling & risk assessment: Check the relationship between accounts receivable ageing and provision levels to prioritize audit focus.
- Operational KPIs: Correlate machine utilization with defect rates to spot trade-offs and target process improvements.
- Client deliverables: Prepare concise, defensible correlation tables and charts that clients can review without raw data manipulation.
- Academic & training: Use the template as a teaching tool—shows calculation steps and interpretation for students and junior analysts.
Each scenario includes a pre-formatted sheet and example so teams can adapt quickly to their own datasets.
Who is this product for?
Targeted at professionals who need accuracy, speed, and clarity:
- Accountants preparing financial analysis or audit-ready evidence.
- Data analysts performing preliminary relationship studies or feature selection.
- SMEs and corporate teams converting operational data into actionable insights.
- Consultants who deliver correlation-based recommendations and need presentable outputs.
ProXlsx also supports Egyptian firms and Arabic-speaking teams with localized guidance and on-demand customization.
How to choose the right version
Variants exist to suit different needs—pick based on Excel version, dataset size, and automation requirements:
- Standard Excel file (recommended): For most users with Excel 2016+; includes matrix, charts, and instructions.
- Office 365 dynamic version: For users with dynamic arrays and LET functions—faster calculations for larger tables.
- VBA-enabled package: Includes macros for batch processing multiple files—choose this if you process repeated monthly files.
- Customized build (hourly service): Request additions like p-values, significance testing, or integration with existing dashboards.
Not sure which fits your workflow? Contact ProXlsx for a short pre-purchase consultation—explaining your Excel version and sample size is enough for a recommendation.
Quick comparison with typical alternatives
Common options and why this template can be a better fit:
- Manual formulas in a blank workbook: Time-consuming, higher risk of error—our template is pre-tested and formatted for clarity.
- Statistical software (R/SPSS): Powerful but requires learning; our Excel template is accessible to finance teams and integrates with existing spreadsheet workflows.
- Third-party add-ins: Useful but may require licenses and admin install—Excel-only template works without extra installs and keeps data in your environment.
Best practices & tips to get maximum value
- Always inspect for outliers before interpreting r—outliers can skew correlation.
- Use the sample dataset to validate steps and to train junior staff.
- When dealing with time series, de-trend or use lagged variables to avoid spurious correlations.
- Combine the correlation matrix with scatter plots to visualize relationship patterns.
- For repeated monthly analyses, use the VBA-enabled version to automate data consolidation and report generation.
Common mistakes when using correlation tools and how to avoid them
- Interpreting correlation as causation: Correlation shows association—use it as a hypothesis generator, not proof of cause.
- Ignoring missing data: Our template documents how missing pairs are handled—review before finalizing results.
- Using small samples: Small n produces unstable r estimates—check sample size guidance included in the file.
- Overlooking variable scaling: Correlation is scale-invariant, but mixed measurement types (ordinal vs continuous) require careful handling.
Product specifications
- File format: .xlsx (Excel workbook)
- Compatibility: Excel 2016+, Office 365; separate VBA-enabled file for macro automation
- Sheets included: Instructions, Sample Data, Pairwise Correlation, Correlation Matrix, Charts
- Core formulas: PEARSON / CORREL functions with clear audit formulas
- Visuals: Scatter plot with trendline, heatmap for matrix
- Localization: English interface; notes available for Arabic-speaking teams upon request
- Delivery: Instant download after purchase; optional hourly customization by ProXlsx team
- Data handling: No external calls—files remain on your machine (no cloud telemetry)
Frequently asked questions
Does the template calculate statistical significance (p-value) for Pearson’s r?
The standard template focuses on Pearson’s r and visual interpretation. A version that includes p-value and significance testing is available as an add-on or via our hourly customization service.
Will this work with Arabic-number formats and right-to-left data?
Yes. Numeric calculations are format-agnostic. The workbook is LTR by default, but we provide localized guidance and can adjust layouts for RTL presentation during customization.
Can I process many variable pairs or large datasets?
The standard template handles typical business datasets. For very large tables or batch processing across files, choose the Office 365 dynamic version or the VBA-enabled variant to improve speed and automation.
How secure is my data during customization work?
ProXlsx performs on-premise edits or secure file exchange per project. We do not retain your raw data beyond the delivery scope—mention requirements when you request hourly services.
Get the template and start analyzing relationships today
Ready for quicker, auditable correlation analysis? Download a tested correlation analysis template built for professionals—plus optional customization from the ProXlsx team if you need integrations or automation.
Includes immediate download, sample data, and concise instructions. Need a custom change? Ask about hourly implementation services after purchase.
Related products
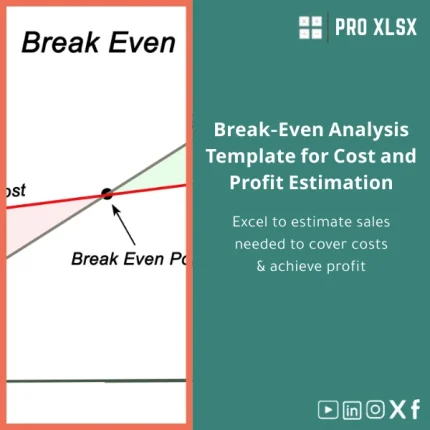
Break-Even Analysis Template for Cost and Profit Estimation
A ready-to-use Break-Even Analysis template in Excel to calculate the sales volume needed to cover costs, model profit scenarios, and produce clear management-ready charts and a margin of safety calculator. Designed for accountants, analysts, and companies who need fast, reliable decision support without complex systems.


Reviews
Clear filtersThere are no reviews yet.