


Master Reducing Excel Errors with These Effective Strategies
Accountants, data analysts, and companies that need professional Excel templates and financial/operational data analysis and organization services rely on accurate spreadsheets to make decisions and report results. This guide to reducing Excel errors explains why small mistakes cost time and money, and gives practical, step‑by‑step techniques — from data validation to Report Automation — you can apply immediately. This article is part of a content cluster that complements The Ultimate Guide: How to choose the right Excel template for your needs and focuses specifically on error reduction tactics for Ready‑Made Templates, Advanced Functions, Pivot Tables, and Project Management Templates.
Why reducing Excel errors matters for accountants, analysts and companies
One incorrect formula, a misplaced copy/paste action, or a hidden lookup failure can change reported profit margins, misstate cash flow or produce regulatory non-compliance. For accountants and financial analysts, the cost of a single spreadsheet error ranges from hours of corrective work to reputational damage or penalties. For operational teams, errors in Project Management Templates can delay deliveries or double-count resources.
Reducing Excel errors increases trust in numbers, lowers audit effort, and speeds up decision cycles. It also enables scalable workflows: when your Ready‑Made Accounting Templates and Report Automation pipelines are reliable, you avoid repeated manual checks and free teams to focus on analysis instead of firefighting.
Core concept: what counts as an Excel error (definition, components, examples)
Definition
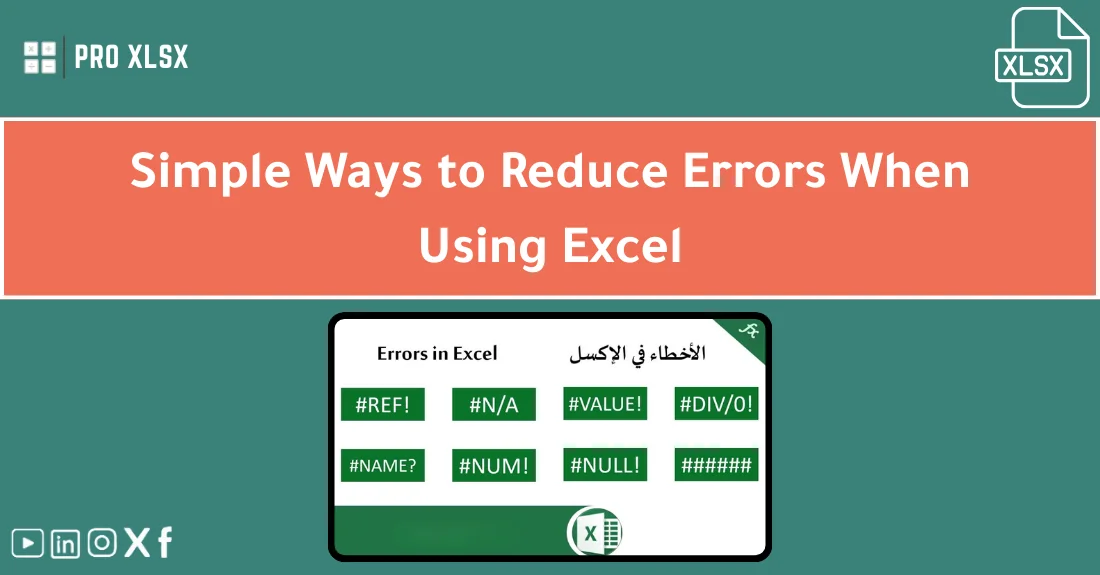
“Reducing Excel errors” means preventing, detecting, and correcting mistakes that affect data accuracy, completeness, or interpretation within a workbook or across related files. Errors can be mechanical (typos, broken links), logical (wrong formula logic), structural (poor layout), or process-related (multiple versions, manual transfer).
Common components of spreadsheet risk
- Input mistakes: wrong amounts, swapped columns, inconsistent units.
- Formula problems: incorrect ranges, relative/absolute reference errors, misused functions.
- Data duplication: repeated records or reconciliations that don’t match.
- Version control and sharing: multiple copies and undocumented changes.
- Hidden biases from manual adjustments or untested Advanced Functions.
Concrete examples
Example 1 — A pivot table that reports revenue by product but excludes new SKUs because the source table’s named range wasn’t dynamic.
Example 2 — An accountant copies a formula down but forgets to lock a tax rate cell ($B$2), producing incorrect tax calculations across 300 rows.
Example 3 — Project Management Templates duplicated for each team lead, and when consolidating, overlaps cause double-counting of contractor hours.
Practical use cases and recurring scenarios
Below are practical scenarios where reducing Excel errors delivers immediate benefits:
Monthly financial close (Accounting)
Use ready-made accounting templates with locked inputs, controlled drop-downs and reconciliation sheets to reduce manual journal entry errors. Typical impact: cut reconciliation time by 30–60% and eliminate 1–2 material adjustments per quarter.
Operational reporting and dashboards (Data teams)
When building dashboards with Pivot Tables and Report Automation, ensure source tables are normalized and use Power Query to centralize transformations — this minimizes errors from ad-hoc formulas and preserves traceability.
Project tracking and resource allocation (PMOs)
Use standardized Project Management Templates with built-in alerts for over-allocations and automated progress calculations. That prevents schedule slips caused by misreported effort or duplicated tasks.
Mergers, audits and consolidation
During consolidation, small mismatches across templates multiply quickly. Use structured templates and checks to reconcile account mappings and currency conversions before roll-up.
Impact on decisions, performance, and outcomes
Reducing Excel errors affects several dimensions:
- Decision quality: accurate inputs lead to reliable forecasts and fewer reactive corrections.
- Productivity: fewer errors mean fewer rework hours; teams can reallocate 10–25% of time to analysis.
- Compliance and auditability: structured templates and documented formulas reduce audit queries.
- Scalability: automated checks and Report Automation allow higher data volumes without proportional risk increases.
Example measurable outcome: a mid-size finance team moving from manual reconciliations to validated Ready‑Made Templates and Report Automation can reduce monthly close cycle from 10 to 6 business days.
Common mistakes and how to avoid them
Understanding typical failure modes helps you prevent them. Below are the most frequent mistakes and corrective actions.
1. Uncontrolled input cells
Problem: Users type values in calculation areas or different formats mix (e.g., “1,000” vs “1000”). Solution: Lock calculated ranges and use data validation with drop-downs and input messages to force correct formats.
2. Fragile formulas and hard-coded values
Problem: Hard-coded constants inside formulas break when assumptions change. Solution: Centralize constants in a single ‘Parameters’ sheet and reference them with named ranges.
3. Copy/paste errors and duplicated sheets
Problem: Teams duplicate templates and then diverge, causing consolidation issues. Solution: Enforce a single source template and manage changes through controlled releases. To learn more about how teams introduce and detect repeated mistakes, read about bad Excel project practices.
4. Hidden or broken links
Problem: External file links break or point to older versions. Solution: Use Power Query to connect to stable sources, and audit external links before reports are published.
5. Insufficient testing and review
Problem: No staging or review step leads to errors reaching reports. Solution: Create a checklist and peer-review process for any template changes and recurring report updates; this reduces the typical range of common Excel mistakes.
6. Duplicate data and reconciliation mismatches
Problem: Data copied between sheets creates multiple truth sources. Solution: Centralize raw data and use formulas or queries to reference it; learn how to avoid duplicate data errors to keep reconciliations consistent.
7. Poor template design
Problem: Inconsistent layout, missing documentation, or too many hidden formulas. Solution: Standardize templates and train users to follow naming, cell color-coding, and documentation practices to avoid template mistakes when deploying Ready‑Made Templates.
8. Overreliance on complex, untested Advanced Functions
Problem: Array formulas, nested functions, and volatile functions can be hard to debug. Solution: Use Advanced Functions with clear comments, step-by-step helper columns, and a test dataset to validate results.
When creating templates or scaling solutions, also review common pitfalls outlined in guidance on mistakes when working in Excel.
Practical, actionable tips and checklist
The following is a hands-on checklist for teams to implement today. Apply steps in the order shown to quickly reduce risk.
- Inventory and prioritize: List your top 10 workbooks by frequency and dollar impact. Start where errors have the highest cost.
- Lock and document constants: Create a ‘Parameters’ sheet with named ranges and lock it. Example: place tax rates, exchange rates, and discount rates here.
- Apply data validation: For every input column, add validation rules (lists, numeric ranges, date ranges) and an input message describing expected values.
- Protect structure: Protect sheets and hide calculation areas. Allow users to edit only designated input cells.
- Use Power Query for ETL: Replace fragile copy/paste with Power Query connections. It reduces manual steps and supports refreshable Report Automation.
- Replace fragile formulas with helper columns: Break complex nested formulas into readable steps. Each helper column should have a short header and comment.
- Build reconciliation checks: Add visible totals and difference lines that change color with conditional formatting when thresholds are exceeded.
- Standardize Naming and Colors: Blue = inputs, gray = calculations, green = outputs. This reduces accidental edits.
- Peer review and testing: Before release, run the workbook with a test dataset and have one peer review formula logic and pivots.
- Automate repetitive reports: Use macros or Report Automation tools to generate standard reports; fewer manual steps equal fewer opportunities for errors.
- Train users and version control: Keep a changelog inside the workbook and store templates in a controlled repository with version tags.
Example implementation timeline for a finance team (4 people): Week 1 — inventory and parameter sheet; Week 2 — data validation and protection; Week 3 — Power Query ETL and pivot rework; Week 4 — testing and rollout. Expected reduction in error incidents: 50–70% within the first month.
KPIs / success metrics to track reducing Excel errors
- Number of spreadsheet incidents reported per month (target: -50% in 3 months)
- Time spent on reconciliations and corrections (hours/month)
- Number of audit queries related to spreadsheet errors
- % of reports generated via automated refresh vs manual export
- Template adoption rate (share of teams using standardized Ready‑Made Templates)
- Number of formulas flagged in static analysis tools or peer review
FAQ
How do I prioritize which spreadsheets to fix first?
Start by scoring spreadsheets on impact (financial or operational), frequency of use, and recent error history. Fix the top 3 that are used daily or cause material adjustments. A simple scorecard (1–5 per dimension) works well.
Are Advanced Functions worth the risk if they reduce manual work?
Yes — Advanced Functions (dynamic arrays, XLOOKUP, LET) are powerful but should be applied with documentation and fallback checks. Use helper columns and test cases to validate complex logic before deploying across teams.
What’s the fastest way to stop duplicate data creeping into reports?
Centralize raw data in a single source (database, Power Query query, or controlled CSV) and drive all sheets from that source. Implement unique-key checks and use conditional formatting to highlight duplicates; see resources to avoid duplicate data errors.
How do I make Project Management Templates less error-prone?
Standardize templates, include resource constraints as formulas (not manual fields), and add roll-up checks for total hours and costs. Also create a change-control process for template updates to prevent divergent copies; this avoids the typical bad Excel project practices.
Can Ready‑Made Accounting Templates save time without introducing hidden errors?
Yes, when templates are well-tested, documented and configured for your chart of accounts and reporting requirements. Always review default assumptions and ensure templates include data validation and clear parameterization to avoid template mistakes.
Reference pillar article
This article is part of a wider content cluster focused on template selection and governance. If you’re deciding which template to deploy next or how to evaluate templates for scalability, consult the pillar article: The Ultimate Guide: How to choose the right Excel template for your needs.
Next steps — quick action plan
- Run a rapid inventory of your top 10 workbooks this week.
- Implement a Parameters sheet and data validation rules in the highest‑impact workbook within 7 days.
- Schedule a peer review and add reconciliation checks before the next reporting cycle.
- Consider trying proxlsx’s Ready‑Made Templates and report automation services to accelerate rollout and reduce risk. Our templates come pre-configured with protection, validation, and best-practice layout so you can scale with confidence.
Ready to reduce errors now? Explore proxlsx’s catalog of Ready‑Made Templates and Report Automation services or contact our specialists for a template audit and remediation plan.