


Master Financial Functions in Excel: FV, PV, NPV, and IRR
Accountants, data analysts, and companies that need professional Excel templates and financial/operational data analysis and organization services rely on accurate time-value-of-money calculations every day. This article explains core Excel financial functions (FV, PV, NPV, IRR), shows clear, practical examples, and gives step-by-step guidance for integrating these functions into Excel Dashboards, Project Management Templates, and Report Automation processes so you can make faster, more reliable decisions.
Why this matters for accountants, analysts, and companies
Financial functions are the backbone of any quantitative financial analysis. Whether you prepare forecasts for a CFO, build an internal Excel Dashboard for operations, or automate monthly financial reporting, FV, PV, NPV and IRR let you translate cash flows into comparable values. Accurate application reduces errors in valuation, improves capital allocation, and accelerates Report Automation for repetitive tasks.
For teams using Ready‑Made Templates or Project Management Templates, embedding robust financial calculations ensures consistency across departments and reduces dependency on manual adjustments. For data analysts, combining these functions with Data Cleansing and Advanced Functions (e.g., XNPV, XIRR, RATE, MIRR) elevates the quality of scenario modelling.
Core concepts and function definitions (FV, PV, NPV, IRR)
Time value of money — the basic idea
Money today is worth more than the same amount in the future because of earning potential. Excel’s financial functions quantify that difference. Use them to convert future cash into present equivalents (PV), project future worth of an investment (FV), or evaluate multi-period projects (NPV, IRR).
FV — Future Value
Definition: FV returns the future value of an investment after a number of periods given a periodic interest rate and a regular payment.
Syntax: =FV(rate, nper, pmt, [pv], [type])
Example: You invest $5,000 now (pv = -5000), expect no additional payments (pmt = 0), at 6% annual for 5 years: =FV(6%, 5, 0, -5000) → future value ≈ 6,691.13.
PV — Present Value
Definition: PV returns the present value of a series of future payments, discounted at a given rate.
Syntax: =PV(rate, nper, pmt, [fv], [type])
Example: Annual payments of $1,000 for 5 years at 6%: =PV(6%, 5, -1000, 0) → PV ≈ 4,212.36. Use PV to compare lease vs buy or to price a loan.
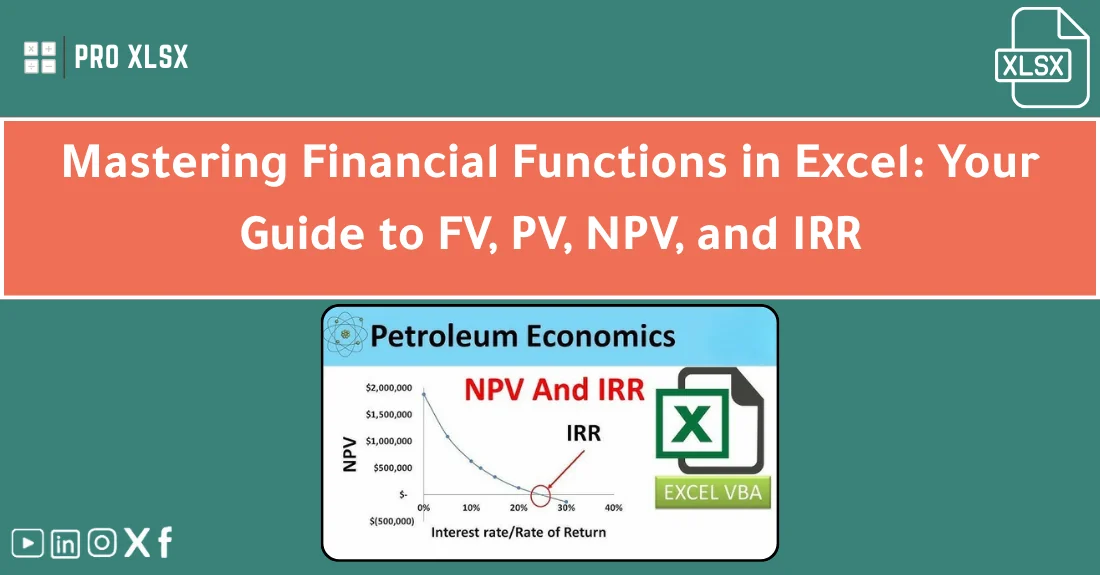
NPV — Net Present Value
Definition: NPV discounts a series of cash flows (usually future inflows) to present value at a specified discount rate. Important: Excel’s NPV function expects future cash flows only — include the initial investment separately (often negative).
Syntax: =NPV(rate, value1, [value2], …) + initial_outlay
Example: Initial investment -$10,000, future cash inflows of $3,000, $4,000, $5,000 at 8%: =NPV(8%, 3000, 4000, 5000) + (-10000) → NPV ≈ 587.30 (positive → accept).
IRR — Internal Rate of Return
Definition: IRR is the discount rate at which the NPV of a series of cash flows equals zero. Useful for ranking mutually exclusive projects with similar scale.
Syntax: =IRR(values, [guess])
Example: Cash flows -10000, 3000, 4200, 5000: =IRR(A1:A4) → IRR ≈ 15.2% (approx). If IRR > required return, the project is acceptable.
When to use XNPV / XIRR and other Advanced Functions
For irregularly timed cash flows, use XNPV and XIRR with explicit dates. Other Advanced Functions like MIRR or RATE help model financing, reinvestment assumptions, or solve for rate when cash flows are regular but non-standard.
Practical use cases and scenarios
Capital budgeting for a mid-size company
Situation: A manufacturing firm evaluating two equipment upgrades. Use NPV to compute the discounted value of each project’s cash flows and IRR to check internal yields. Build a comparison table in a Project Management Template with sensitivity columns (±1% discount rate) and integrate into an Excel Dashboard that shows NPV by scenario.
Lease vs buy decision for accounting teams
Simpler PV calculations help compare present value of lease payments versus purchase price financing. Use PV to standardize periodicity (monthly lease payments vs annual depreciation) before feeding numbers into accounting templates and reports.
Valuing a subscription business
Data analysts: forecast monthly recurring revenue (MRR) and apply discounting to calculate present value of projected cash flows. Use XNPV when signups and churn dates are irregular. Then include outputs in a Ready‑Made Template for recurring reporting and KPI tracking.
Integrating into Report Automation and Dashboards
Combine these formulas with named ranges and structured tables. Automate report refreshes with Power Query for cash flow inputs, then feed outputs into Excel Dashboards for monthly executive reports. Use Report Automation to push updated NPV/IRR figures into PDFs or PowerPoint summaries.
Impact on decisions, performance, and outcomes
Accurate financial functions yield measurable improvements:
- Better capital allocation — funding flows to higher NPV projects.
- Faster review cycles — templates and automation reduce manual recalculation time by 30–70% depending on process maturity.
- Fewer reporting errors — consistent use of sign conventions, named ranges, and Data Cleansing reduces reconciliation issues in audits.
- Improved stakeholder confidence — when projections use standardized functions and are presented in Excel Dashboards, stakeholders can quickly validate assumptions.
Examples: A finance team that standardized templates and automated NPV calculations reduced proposal review time from 4 days to 1.5 days and increased accepted projects with positive NPV by 12% year over year.
Common mistakes and how to avoid them
- Sign conventions: Many users forget that Excel requires consistent signs (outflows negative, inflows positive). Solution: Adopt a template convention and validate with a “sanity check” row that sums cash flows.
- Omitting the initial outlay in NPV: Excel’s NPV function excludes the initial cash flow by design. Solution: Add the initial investment separately (NPV(…) + initial_outlay).
- Wrong period-rate matching: Using an annual rate with monthly cash flows produces incorrect results. Solution: convert rates (annual_rate/12) or keep consistent periods across inputs.
- Using IRR for non-conventional cash flows: IRR can give multiple rates for irregular sign changes. Solution: Use XIRR or MIRR, or present both IRR and NPV to decision-makers.
- Not cleaning source data: Garbage in → garbage out. Solution: apply Data Cleansing steps (trim, remove non-numeric characters, convert text to numbers, validate dates) before calculations.
Practical tips and implementation checklist
Follow this step-by-step checklist when implementing financial functions into templates, dashboards or automated reports.
- Data cleansing: Normalize dates, ensure numeric types, remove duplicates, and check negative/positive signs.
- Define periods: Decide whether analysis is monthly, quarterly or annual and convert rates accordingly.
- Choose the right function: FV for projection, PV for valuation, NPV/IRR for multi-period projects, XNPV/XIRR for irregular dates.
- Use named ranges and structured tables: Improves readability and reduces formula errors in Project Management Templates.
- Document assumptions: Discount rate, reinvestment rate (if using MIRR), inflation assumptions — store these in a dedicated assumption table for easy scenario switching.
- Scenario & sensitivity analysis: Create data tables or use one-click scenarios to show how NPV changes with +/- 1% discount or +/-10% cash flow variations.
- Integrate into dashboards: Expose key outputs (NPV, IRR, payback period) as tiles/visuals in Excel Dashboards for executives.
- Automate updates: Use Power Query to refresh cash flow inputs and trigger recalculations; embed formulas in Ready‑Made Templates for repeatability.
- Audit and test: Build a simple checklist of test cases (known PV/FV examples, benchmark IRR cases) and verify outputs.
Quick formula cheatsheet
- FV: =FV(rate, nper, pmt, [pv], [type])
- PV: =PV(rate, nper, pmt, [fv], [type])
- NPV: =NPV(discount_rate, cashflow_range) + initial_outlay
- IRR: =IRR(cashflow_range, [guess])
- XNPV: =XNPV(rate, values, dates)
- XIRR: =XIRR(values, dates)
KPIs & success metrics
- NPV acceptance rate: % of proposals with positive NPV
- Average IRR across approved projects vs hurdle rate
- Forecast variance: Actual cash flows vs projected (monthly/quarterly)
- Time-to-report: Hours to generate financial dashboard before vs after automation
- Error rate in financial models: Number of formula or sign errors found in audits per quarter
- Template reusability: Number of teams adopting Ready‑Made Templates / Project Management Templates
- Process automation coverage: % of reports automated in Report Automation workflows
FAQ
Q: What’s the difference between NPV and IRR and which should I trust?
A: NPV gives a dollar value of value created at a specific discount rate; IRR gives the break-even rate. Use NPV for absolute value comparison and IRR to communicate percentage returns. When projects differ in scale, NPV is the more reliable decision rule.
Q: My cash flows are irregular in timing — should I use NPV/IRR or XNPV/XIRR?
A: Use XNPV and XIRR when cash flows occur on irregular dates. They allow you to pass explicit dates and compute precise discounting. Regular NPV/IRR assume equally spaced periods and will be inaccurate for irregular schedules.
Q: Why does my NPV formula return a different number than a colleague’s model?
A: Common causes: different discount rate or period conversion, omitted initial outlay, inconsistent sign conventions, or data errors. Compare assumptions table, check that both models use the same periodicity (monthly vs annual), and ensure the initial investment is included correctly.
Q: IRR returns #NUM! or multiple values — how to handle it?
A: #NUM! often means the function can’t find a rate that zeroes NPV based on your guess; try a different guess or use XIRR. Multiple IRRs occur with non-conventional cash flows (multiple sign changes); prefer NPV or MIRR in those cases and present both results to stakeholders.
Q: How do I structure a template for repeated investment analysis?
A: Use a dedicated assumptions table (discount rate, inflation, growth), structured cash flow tables, named ranges, and a results area with NPV, IRR, payback and sensitivity outputs. Lock formula cells and use data validation to prevent accidental edits.
Next steps — try it with proxlsx templates
Ready to implement standardized financial calculations across your team? proxlsx offers Ready‑Made Templates and Project Management Templates that include FV, PV, NPV and IRR presets, plus built-in Data Cleansing and Report Automation hooks. Start with a small pilot: pick one recurring report, migrate inputs to a structured table, apply the NPV/IRR checklist above, and automate refreshes with Power Query.
Action plan (30–90 days):
- Week 1: Cleanse sample cash flow data and agree on period conventions and discount rates.
- Week 2–3: Load the cash flows into a proxlsx Ready‑Made Template and validate outputs with known examples.
- Week 4–6: Add scenario & sensitivity analysis and publish a basic Excel Dashboard for stakeholders.
- Week 7–12: Automate source refresh and integrate results into monthly reporting via Report Automation.
To explore templates or request a custom implementation for your finance or analytics team, visit proxlsx or contact our team to get a tailored demo.
Reference pillar article
This article is part of a content cluster on Excel fundamentals and advanced usage. For broader context and beginner-friendly coverage, see the pillar article: The Ultimate Guide: A beginner’s guide to Excel – everything you need to know, which covers core skills, functions and how to scale Excel workflows across an organization.