


Interactive Change Initiatives Dashboard Template for Excel
Original price was: $48.33.$37.53Current price is: $37.53.
A ready-to-use Change Initiatives Dashboard Template that turns project status and completion rates into a clear, interactive Excel dashboard — built for accountants, data analysts, PMOs and companies that need fast, reliable visibility into departmental change progress.
Key benefits & value for the buyer
The Change Initiatives Dashboard Template saves time, improves transparency and reduces reporting errors. Instead of manual consolidations and multiple spreadsheets, you get a single control panel that:
From features to outcomes
- Automated status aggregation — reduces monthly reporting time by consolidating status updates into one table and computing completion rates automatically.
- Clear visual signals — conditional formatting and progress bars make at-risk initiatives visible to executives and auditors within seconds.
- Custom filters and slices — view progress by department, owner, programme or quarter for focused conversations.
- CSV / PDF export-ready — create board-ready reports without extra formatting work.
- Scalable structure — supports small change portfolios and larger transformation programs with the same template architecture.
Use cases & real-life scenarios
Monthly PMO reporting
A PMO manager imports team status updates into the template, filters by active programmes, and exports the dashboard snapshot for the executive meeting — saving hours previously spent preparing slides.
HR-led transformation
The HR transformation lead tracks adoption milestones across departments, uses RACI fields to assign accountability and monitors completion rates to decide training priorities.
Finance and audit
Accountants and internal audit teams use the dashboard to map change initiatives to cost centres, ensuring financial controls are applied during transition phases and reporting exceptions quickly.
Who is this product for?
- Accountants and financial controllers who need operational visibility of change projects tied to budgets.
- Data analysts who want a structured, Excel-native source to produce KPIs and dashboards.
- PMOs, transformation leads and HR teams managing cross-department initiatives.
- Small-to-medium Egyptian companies wanting professional dashboards without enterprise software costs.
- Consultants and auditors who need exportable evidence of change progress.
How to choose the right version
The template is offered in practical variants. Choose based on Excel version, scope and support needs:
- Standard (recommended) — Works in Excel 2016+ and Office 365, includes pivot-ready source tables and interactive filters.
- With VBA automation — Adds one-click refresh, CSV import and PDF snapshot macros (macro-enabled .xlsm file). Choose if you want automated refresh and exports.
- Custom implementation (hourly) — If you need branding, Arabic/English label changes, or integration with your ERP database, order hourly execution services from ProXlsx for fast, customised delivery.
If compatibility is a concern: the standard version avoids macros and will work across most environments. The macro-enabled version is for teams that allow signed macros; ProXlsx can help sign or adapt code as needed.
Quick comparison with typical alternatives
Alternatives include manual spreadsheets, BI tools or custom development. Compared to them:
- Vs manual spreadsheets: Faster, less error-prone and standardized structure for repeatable reporting.
- Vs enterprise BI: Lower cost, faster deployment and full Excel portability — ideal when your priority is speed and control, not a full platform roll-out.
- Vs custom software: Immediate ROI and easier handover to internal teams; ProXlsx offers paid customization if you outgrow the template.
Best practices & tips to get maximum value
- Keep a single source table per reporting period — import or paste raw updates into the designated sheet to avoid broken links.
- Use consistent status codes (e.g., On Track, At Risk, Delayed) — the template maps these to visuals automatically.
- Schedule a monthly refresh routine — if using macros, set a one-click process; otherwise use the pivot refresh button.
- Customize headers and department lists once — changes propagate across graphs and filters.
- Combine with ProXlsx hourly services for fast integration with your ERP or project trackers.
Common mistakes when buying/using dashboards and how to avoid them
- Buying a template that doesn’t match Excel version: Verify your Excel version. Choose the non-VBA option if macros are blocked in your environment.
- Expecting a plug-and-forget solution: Dashboards reflect data quality — establish a short data-entry guideline for teams before rollout.
- Over-customizing before testing: Test the standard template with real data first; then request customizations through ProXlsx to avoid breaking formulas.
Product specifications
- Format: Excel workbook (.xlsx) or macro-enabled (.xlsm) for VBA automation
- Compatibility: Excel 2016+, Office 365 (Windows & Mac for .xlsx; macros primarily for Windows)
- Core modules: Data input sheet, Master status table, Executive dashboard, Department drill-downs, Export/PDF snapshot
- Languages: English; labels editable for Arabic/other languages
- Delivery: Instant digital download after purchase; customization available via hourly ProXlsx services
- Support: Setup notes included; optional paid onboarding and customization
Frequently asked questions
Will this work with Excel on Mac and Office 365?
Can I connect the dashboard to our project management tool or ERP?
How customizable is the template — can we add company branding and fields?
What if we need help after purchase?
Ready to simplify your change reporting?
Get the Interactive Change Initiatives Dashboard Template and start producing consistent, executive-ready change reports today. Download instantly and, if you need help, order paid customization or hourly implementation from ProXlsx.
Not sure which version you need? Purchase the standard file and contact ProXlsx for a quick pre-purchase compatibility check or to add automation as a follow-up service.
Related products
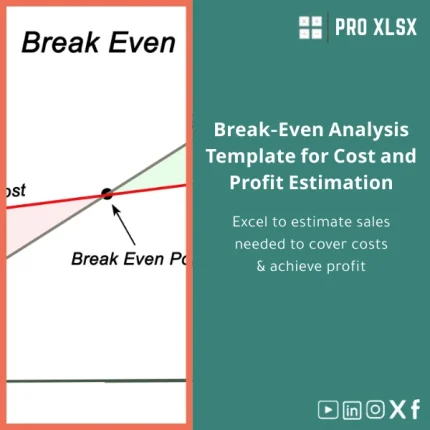
Break-Even Analysis Template for Cost and Profit Estimation
A ready-to-use Break-Even Analysis template in Excel to calculate the sales volume needed to cover costs, model profit scenarios, and produce clear management-ready charts and a margin of safety calculator. Designed for accountants, analysts, and companies who need fast, reliable decision support without complex systems.


Reviews
Clear filtersThere are no reviews yet.