


Investor Financial Ratios Template for Excel Analysis
Original price was: $48.33.$37.53Current price is: $37.53.
A ready-to-use Excel financial ratios template that computes P/E, ROE, ROA, EV/EBITDA and more — plus interactive dashboards and benchmarking tools to speed up equity valuation and portfolio screening for accountants, analysts and teams.
Key benefits & value for the buyer
This Investor financial ratios template turns raw financial statements into investment signals in minutes. Instead of building multiple spreadsheets, you get a single organized workbook that saves time, reduces calculation errors, and standardizes analysis across your team.
Top translated features into benefits
- Pre-built ratio library → Instant, auditable results for common investor metrics (P/E, PEG, ROE, ROA, Gross/Net margins).
- Dashboard & charts → Faster decision-making with visual trend lines and peer comparisons.
- Scenario & sensitivity module → Test price, growth and margin assumptions without rebuilding formulas.
- Import templates + optional VBA → Seamless update from exported trial balance or CSV files; reduces repetitive manual work.
- Localized settings → Works with different currencies and fiscal year structures common to Egyptian companies and regional clients.
Use cases & real-life scenarios
Concrete examples showing how firms use this Excel financial ratios template:
- Audit firm: prepare comparative ratio tables for three-year client reviews, with notes ready for the management letter.
- Equity analyst: screen a watchlist with threshold filters (P/E < 15, ROE > 15%) and export candidate summaries for pitchbooks.
- Finance manager: convert monthly trial balance exports into KPIs and monitor covenant ratios for lenders.
- Investment team: run sensitivity on price targets using the included stock valuation model and scenario toggles.
Who is this product for?
Designed specifically for accountants, data analysts, financial controllers, investment analysts, and companies that need reliable Excel tools for financial and operational analysis. If you need fast, repeatable, auditable investor ratios analysis Excel solutions without heavy BI stacks, this template is for you.
How to choose the right version
We offer flexible options to match team size and workflow:
- Basic (no macros): single-user, manual data entry, ideal for quick downloads and auditors who prefer macro-free files.
- Standard (with optional macros): includes import routines and automated benchmarking — best for analysts who update data weekly.
- Pro (VBA automation + hourly setup): includes custom data import, tailored dashboards and one hour of setup support from ProXlsx experts — recommended for teams and companies.
If unsure, select Standard or contact our hourly services for a short onboarding session to match the template to your chart of accounts and currency format.
Quick comparison with typical alternatives
Common choices are: build in-house, buy a generic template, or use the Investor Financial Ratios Template.
- Build in-house → high time cost, inconsistent formulas, difficult to standardize across staff.
- Generic templates → may lack local fiscal options, sensitivity modeling or audit trails.
- ProXlsx template → ready, auditable, localized, and upgradeable with hourly execution services if you need custom mapping or automation.
Best practices & tips to get maximum value
- Map your chart of accounts once: reduces future manual cleanup and ensures accurate ratios.
- Use the import routine (Standard/Pro) for monthly updates — it saves >70% of manual entry time for active portfolios.
- Lock the calculation sheets and keep an inputs-only sheet for client presentations.
- Use scenario snapshots when sharing valuation assumptions with stakeholders to preserve decision context.
Common mistakes when buying/using ratio templates — and how to avoid them
- Buying a template without checking compatibility — verify Excel version and macro policy before purchase.
- Failing to standardize input periods — always align fiscal years before running peer comparison.
- Ignoring documentation — the included quick guide avoids errors in interpretation of ratio definitions and calculation logic.
Product specifications
- File format: .xlsx (Basic/Standard) and .xlsm (Pro with macros)
- Compatible with: Excel 2016, 2019, Office 365 (desktop recommended for VBA features)
- Included sheets: Inputs, Financial Statements, Ratio Library, Dashboard, Peer Benchmarking, Sensitivity/Valuation
- Pre-calculated ratios: P/E, PEG, P/B, EV/EBITDA, ROE, ROA, Gross Margin, EBIT Margin, Current Ratio, Quick Ratio
- Localization: Currency & fiscal year settings, Arabic/English labels available on request
- Delivery: Instant download after purchase + PDF quick-start guide
- Support: Email support + optional hourly customization services from ProXlsx team
Frequently asked questions
Does this template work with Arabic-language financial statements and Egyptian fiscal years?
Yes. The template supports different fiscal year formats and currencies. Standard and Pro versions include localization options; Pro includes one hour setup to map Arabic labels to the template if required.
Are macros required to use the main features?
No. Basic ratio calculations and dashboards work in macro-free .xlsx files. Macros (VBA) are optional and available in the Pro version for automated imports and bulk updates.
Can I use this for bulk screening of multiple companies?
Yes. The Standard version includes peer benchmarking designed for multiple companies. For bulk CSV import and automated refresh, choose the Pro version or request an hourly service to set up the workflow.
What support is included after purchase?
Every purchase includes a PDF quick-start guide and one week of email support for installation questions. Optional hourly execution services are available for mapping, automation or custom dashboard requests.
Ready to speed up your analysis?
Get an auditable, repeatable investor ratios workflow today — instant download, clear documentation, and optional professional setup from ProXlsx analysts.
Need customization or a quick setup call? Contact ProXlsx after purchase to book hourly execution support.
Related products
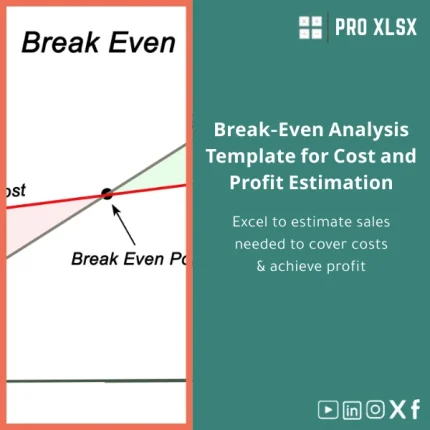
Break-Even Analysis Template for Cost and Profit Estimation
A ready-to-use Break-Even Analysis template in Excel to calculate the sales volume needed to cover costs, model profit scenarios, and produce clear management-ready charts and a margin of safety calculator. Designed for accountants, analysts, and companies who need fast, reliable decision support without complex systems.
Budget Planner Excel Template for Actual and Variance Analysis
Customers Suppliers Tracking Template for Excel Invoices and Payments

Excel Cash Flow Template for Tracking Inflows and Outflows
Excel Fixed Assets Management Template with Auto Depreciation

Excel Journal Entries Template with Auto GL Mapping

Financial Statements Template for Easy Preparation of BS, P&L & Cash Flows
Interest Calculation Template for Excel with Cash Discounts
An Excel-ready interest calculation template that computes simple and compound interest, generates early‑payment cash discount schedules, and converts those results into clear reports and cashflow tables — built for accountants, data analysts, and finance teams who need reliable, fast answers without custom development.

Reviews
Clear filtersThere are no reviews yet.